
I worked as a field biologist and project manager for various state and federal agencies, and private environmental consulting firms for nearly 20 years across North America. That time blessed me with the opportunities to see remote areas across the country, conduct all kinds of plant and wildlife surveys, and use plenty of standard and non-standard field equipment. But across all of those thousands of field days, I was constantly telling myself there had to be more efficient ways to use technology to collect, map, process, and share field data.
My article in the previous issue of the BayGeo Journal highlighted much of what I learned during the past seven years of development and field use of a Mobile GIS solution before I left environmental consulting to work in a career focused on helping others transition away from traditional collection methods to Mobile GIS. With this current article, I would like to discuss the power of connected data collection via cloud computing. To do this, I will examine some of my past field survey work that could have benefited immensely from today’s Mobile GIS solutions.
Using Mobile GIS equipment and workflows with cloud computing can streamline data collection and management for field staff and allow managers to make more timely and informed land management and conservation decisions. These workflows also greatly increase the efficiency of reporting. Not only can these solutions save man-hours and money, but also reduce potential human errors introduced by recording field data on paper and then having to manually enter that data into a computer database. For workers in areas with cellular service, these cloud computing solutions can also eliminate accidental field data duplication when teams overlap without realizing it. For those that work in remote areas with no cell service, the data can be stored on their tablet and then uploaded to the cloud back at the office with a WiFi connection.
A Hypothetical Data Collection and Reporting Problem
I have worked with dozens of state and federally threatened and endangered species across the U.S. One of the most daunting aspects of their management is pooling all the collected population monitoring data for a given species in each breeding season and analyzing the data. This is a problem because a single species often covers multiple states, with their populations being monitored and managed by multiple agencies and groups, or even multiple agencies in a single state. Thus, sharing and compiling a complete database examining population monitoring results can be a difficult task even within a single agency, and a final year’s report may often be a year behind.
To provide an example of how efficient these new cloud computing workflows can be, I will draw on my experiences working for the California Department of Fish and Wildlife (CDFW) where I worked on everything from California Gnatcatchers, to Quino checkerspot butterfly, to mountain yellow-legged frog. Based on the work I did with various avian species I will describe the more common workflow and equipment for collecting population and breeding survey data and then highlight how today’s Mobile GIS could be used to make that work more efficient.
Since special status bird species tend to have more standardized data collection forms and banding requirements from the United States Fish and Wildlife Service (USFWS), I’ll use a hypothetical beach nesting bird for our example, the Shiny Sandpiper. The Shiny Sandpiper lays a single egg on sandy beaches from Baja California, north to the San Francisco Bay Area. Undisturbed sandy beaches are in short supply along the California coastline. Thus, the Shiny Sandpiper’s population has been steadily decreasing for the last 50 years and has been given Endangered status by both the USFWS and CDFW. To better support this species, California has implemented a statewide breeding monitoring program. However, due to a large number of breeding beaches, some beaches are owned by the state and some by the federal government at military installations. Thus, some populations are monitored by state employees, some by federal employees, and some by private contractors.
The current workflow for monitoring the Shiny Sandpiper populations consists of teams of biologists walking line transects on breeding beaches fenced off from the public. When a nest is discovered, field surveyors record information about the nest on a standardized paper data sheet (Figure 1.). Not all, but some teams use a consumer-grade GPS or GNSS (3-5 meter accuracy) to record the latitude and longitude of the nest on the paper data sheet. Upon repeat visits to the nests, the observers record data about the nest (active, abandoned, predated, hatched, fledged, etc.).

Figure 1. Example of Shiny Sandpiper breeding survey paper datasheet.
Another purpose of this population monitoring is to track and report any sightings of post-mortem predation or predators that might be harassing the breeding colony. These data are shared with a local animal control team that can safely remove and relocate any mesopredators such as skunks, foxes, feral cats, Common Ravens. If chicks are found, they are banded, and that data is also recorded on paper data sheets to be supplied to USFWS.
Reporting requires an office employee to sit down at a computer and transcribe the field paper data sheets into a spreadsheet or database. This can introduce errors since data is being recorded twice, and there are often problems with the data entry person’s ability to read a field surveyor’s handwriting. Finally, these data must be either shared to a data manager for all breeding populations or written up in a report and then shared with state agencies. Ultimately, these are tried and true methods of data collection and reporting that have been implemented for many wildlife species across the country for decades. However, no one can argue against the point that these methods are highly inefficient.
Mobile GIS and Cloud Computing; a Boon in Efficiency
Hypothetically speaking, if I was placed in charge of managing the population data and producing annual reports for the entire California population of the fictional Shiny Sandpiper, I would mandate a specific data collection software solution across all population monitoring teams. This would achieve multiple goals in the most time efficient and cost-effective manner possible.
Field Equipment
The first things that would have to go are the paper data sheets. The ability to use tablets for data collection has effectively replaced the need for paper. This eliminates the time and budget wasted transcribing the data to computers back in the office. It also completely eliminates the potential for data entry errors during the office transcribing process. Thus, quality assurance increases with this field tablet data entry method.
I know that right now some readers are having heart palpitations at the idea of ditching paper data sheets in exchange for all electronic data entry. The benefits in efficiency and budget savings far outweigh the odd chance that a field team shows up to their worksite one morning only to find their tablet has a dead battery or is not working properly. I know, I know, this is an uncomfortable concept to many. However, I successfully did this exact thing on a multi-state stream restoration monitoring project in 2013 to prove the initial concept. My coworkers sweated the idea immensely as we worked in extremely remote areas for weeks at a time. But you know what? That company and thousands of other field surveyors across the country have moved to digital-only field data collection methods over the last five years, with great success.
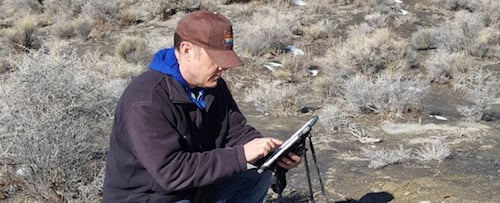
The next thing I would do is get a rugged field-worthy tablet. Mobile GIS users across the U.S. have hundreds of thousands of successful hours using an iPad in a waterproof rugged case and an anti-glare screen protector for the fraction of the price of a ruggedized Windows or Android tablet. This is my go-to solution for any fieldwork and I used it successfully for years on biological surveys across the country (Figure 2.).

With this solution, I would also opt for an RTK receiver that can connect via Bluetooth to the field iPad. With this, the field users can connect to the California Real-Time Network and immediately achieve centimeter-level accuracy. This level of mapping accuracy will allow data analysts and land managers to better examine the nesting preferences of the Shiny Sandpiper on a level of detail never possible before. There is really no telling what micro detail of this species nesting habitat needs/preferences that we had previously been missing. But determining it may make the difference between maintaining this species in perpetuity by changing a small characteristic of the breeding sites topography or vegetation spacing, or watching the populations slowly blink out.
Figure 2. Field biologist using Anatum's ruggedized iPad with Esri Collector for ArcGIS software.
Cloud Computing
There are many different cloud computing data collection software options out there. Given most of my clients utilize the ESRI software suite, I will speak to that (but there are other cloud-based GIS software options out there). I would set up a database system using the ESRI Cloud solution, ArcGIS Online. With this system, I could start with a database of all the known locations of Shiny Sandpiper breeding sites in California (Figure 3). Recognizing that some large breeding sites have multiple field survey teams, I would next assign each field survey team an ArcGIS Online account.

With this ArcGIS Online account, each user can collect field data electronically on their tablet with their login credentials. I could also program their tablets so each field user could see the data collected by other teams at their breeding site, but not at other sites they are not working on. The field surveyor would enter their monitoring site with their Field iPad running ESRI Collector for ArcGIS and connected via Bluetooth to an RTK GNSS receiver. Or, I could decide to have the field surveyors use Esri’s Survey 123 app, either can be used depending on the project managers preference.
Figure 3. Locations and population densities of the Shiny Sandpiper in May 2018 (hypothetical).
- Upon finding a Shiny Sandpiper nest, the user would:
- Hold the receiver’s antenna near the nest and record its location on the tablet in the Collector app. This would automatically capture the latitude, longitude, elevation, estimated accuracy, date and time of each nest recorded.
- The user would then enter the required data for the sighting. This would be all the same data normally collected on the paper data sheets.
- The user could also quickly capture a photo with the tablet and have it directly linked to the nest point in Collector for viewing in ArcGIS Online, and inclusion with final reports if necessary.
- Finish and tap the Save button and move on to searching for the next nest.
The location, time, date, and user name would be automatically captured with every recorded siting. This data would then be automatically synced to the master database stored in ArcGIS Online. If there were other teams on the survey site, they would also see the data automatically populate to their tablet running Collector. This way, the teams could eliminate the potential of accidentally recording the same nest more than once.
To show an example of how this would work if we used Survey 123 instead of the Collector app, you can visit this link and complete a test survey form for yourself LINK (Figure 4).

Another great facet to this system is upon repeat visits to the breeding site, surveyors would be able to use the map interface in Collector to view known nest locations on the tablet screen along with their live position cursor thanks to the external GNSS receiver. This would greatly help them with navigating back to existing nests, so they could further monitor the success or failure of the nest.
This same workflow would be utilized for any findings of predators or any predated Shiny Sandpipers. Although, the difference is, these collected data points would also send an automatic message to the breeding site’s animal control personnel in ESRI’s WorkForce app. This would allow the animal control person to get timely alerts to predator sightings and the exact location of that sighting on or around the breeding site by viewing the data on their phone or tablet.
If I had existing geospatial data from the previous year’s survey in my GIS, I could push that data to ArcGIS Online for the users to see on their tablets in the field. However, since Shiny Sandpipers (and most ground-nesting birds) build a new nest every year, this wouldn’t be very useful for the field staff as they head out on a new season of nest searching and monitoring.
Figure 4. Shiny Sandpiper breeding survey form created with Esri's Survey 123 app.
Reporting
As the project manager in charge of tracking and creating a breeding season’s population monitoring data for the Shiny Sandpiper, my life would now be much easier. For example:
- The nesting location data would be collected much more accurately (both spatially and with better quality assurance),
- Data would be automatically uploaded to the ArcGIS Online master database for every breeding site in California, providing me with timely access to all the data across the state (Figure 5).
- I could keep daily tabs on field teams and easily verify they are working when expected,
- I could also complete supervisor level examinations of their field data to be sure they are collecting data correctly instead of having to wait until the end of the breeding season when they used to turn over all the season's data in a lump sum.
- I could quickly see any spikes in predation at any given breeding site that might need immediate evaluation,
- Finally, I’d have immediate access to all the raw data and could assign staff to write the breeding season report for each of the breeding sites before examining the entirety of the California population.

Figure 5. Data entered with Survey 123 has automatic reporting features that can allow the visualization of all field data types shown in column graph, bar chart, pie chart, or mapped depending on the user preference.
Final Thoughts
This article expresses my personal views on field data collection and ways to make it both more user friendly and more efficient. It is in no way intended to speak poorly of any wildlife manager or other personnel that is currently using paper datasheets for field data collection. This article is meant as an examination of potential hardware and software workflows, thanks to mobile technology, that can increase efficiency and data quality. This article is also not meant to be a sales pitch for ESRI’s software products but is meant as an example of how cloud computing for GIS mapping work can save large amounts of time and project budget. There is plenty of different software out there that utilizes cloud computing services, such as the fine agricultural app CropTrak and the Wildnote app for natural resources.
Since this was my dream example, I went all out with an iPad paired with an RTK receiver for real-time sub-10cm positional accuracy. However, this solution could have just as easily worked in remote areas with no cellular service or used a real-time submeter GNSS receiver Bluetooth connected to the tablet.
Ultimately, a cloud computing solution makes life easier for all parties involved. Field users get a tablet solution that interfaces much the same way as their smartphone and allows them to collect all their data (sighting information, geospatial data, and photos) with one device. Supervisors can easily manage their field surveyors and interface with other groups, such as the hypothetical animal control staff that deal with predators. Managers receive their raw data and breeding population results in a timely manner, allowing for quicker management decisions and budget savings overall.
